Elevation profile of Godavari River Basin
The Godavari Basin is predominantly a plateau landscape, with much of its interior lying at 300–600 m elevation. About 32% of the basin falls within the 500–750 m elevation range, while the western margin rises sharply along the Western Ghats from 600 to >1600 m. The northern part comprises elevated tablelands ranging from 600 to 1,200 m, whereas the southern plains generally occur above 300 m. Overall, the basin exhibits a gradual eastward decline in elevation, forming a diverse topographic gradient from the Western Ghats to the coastal delta.
Soil Erodibility Map
The soil erodibility (susceptibility of soils to erosion) raster derived from the Harmonised World Soil Database (HWSD) following the Environmental Policy Integrated Climate (EPIC) model. Spatial distribution of soil erodibility across the Godavari Basin, with values ranging from 0 to 0.052 t ha h MJ⁻¹ ha⁻¹ mm⁻¹. Higher erodibility values are mainly concentrated in the western and central parts of the basin, while comparatively lower values occur across parts of the eastern and southern regions. The spatial variability reflects differences in soil properties and indicates areas that may be more susceptible to soil erosion and associated sediment loss.
Rainfall Erosivity Map (based on IMD rainfall dataset (2002-12; 2012-22))
The spatial distribution of rainfall erosivity across the Godavari Basin, with values ranging from 261 to 2,971 MJ mm ha⁻¹ h⁻¹. Rainfall erosivity generally increases from the western to the eastern parts of the basin, with the highest values concentrated in the central–eastern region. The pronounced spatial gradient reflects variations in rainfall intensity and amount, highlighting areas where intense rainfall may contribute more strongly to soil detachment and erosion.
Spatial patterns of sediment export yield across major sub-basins in Godavari Basin for 2011–12 and 2021–22
Sediment export represents the total sediment transported from the landscape into the river system. Across the Godavari Basin, high sediment export was observed particularly in the Indravati, Wainganga, Sabari and Penganga sub-basins, with spatial variations largely influenced by slope, rainfall and land-use/land-cover (LULC) characteristics. Temporal comparisons showed an overall decline in sediment export between 2011–12 and 2021–22 in most sub-basins, although increases were observed in Manair, Pravara and Kaddam. These variations highlight the important role of LULC transitions, rainfall variability and sediment retention by dams in regulating sediment export across the basin.
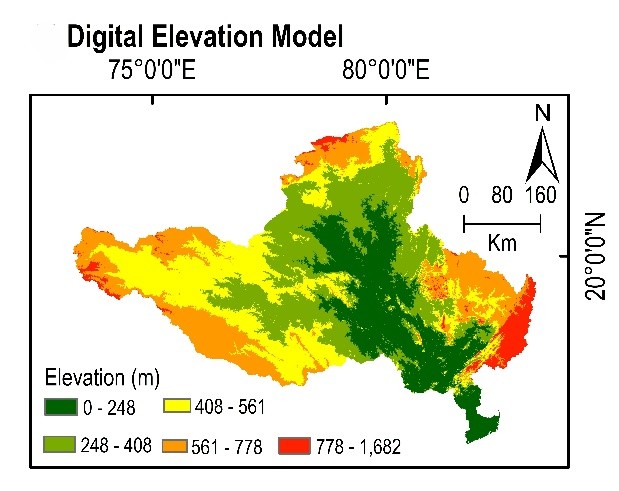
Elevation profile of Godavari River Basin
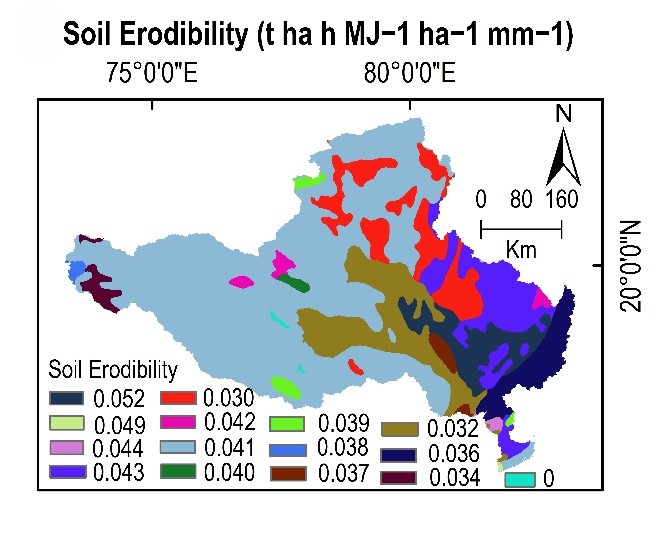
. Soil Erodibility Map (Generated based on EPIC model method (Sharpley and Williams, 1990) of Godavari Basin
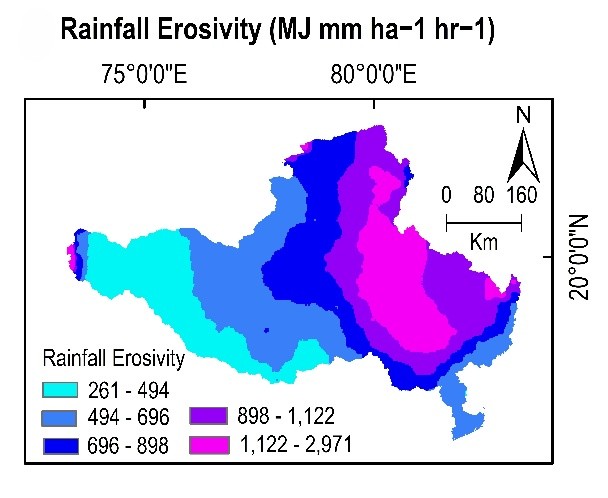
Rainfall Erosivity Map (based on IMD rainfall dataset (2002-12; 2012-22))
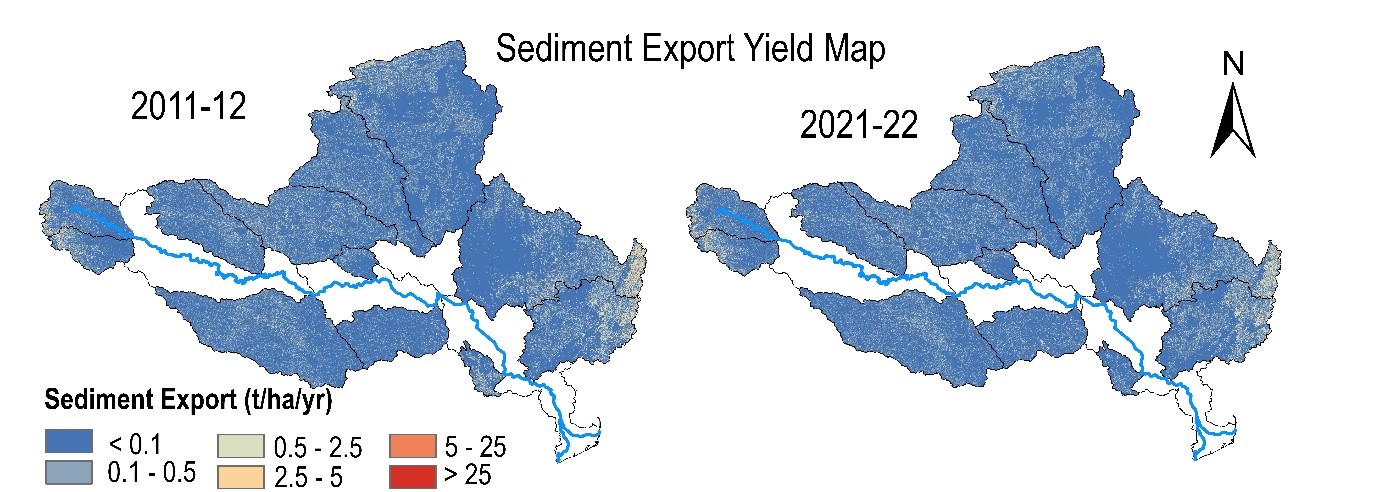
Spatial patterns of sediment export yield across major sub-basins in Godavari Basin for 2011–12 and 2021–22. The maps depict basin-wide variations and highlight temporal changes in sediment dynamics between the two periods